State of Ethereum in Q3 2022
Messari recently published a comprehensive report on the State of Ethereum in Q3 2022. We read the whole report so that you don't have to!
Messari recently published a comprehensive report on the State of Ethereum in Q3 2022. We read the whole report so that you don't have to! Here's a comprehensive summary:
Before we get started... Want early access to our research threads? Sign up to our Substack to receive daily coverage on everything you need to know about going on in the crypto directly in your inbox:
Done? Now let's dive in!
A Primer on Ethereum
The Ethereum network is a decentralized data storage and transaction validation platform. The protocol gained broad recognition after the groundbreaking introduction of smart contracts.
As a result, there are thousands of individual tokens and applications built on top of the #Ethereum blockchain. Ethereum has become the world's second-largest cryptocurrency by market capitalization.
NETWORK PERFORMANCE
Protocol's revenue:
The protocol's revenue has plummeted to near-all-time lows. This might be due to the following factors:
Crypto bear market
Increased volume on L2s
The upgrades in protocol contracts for gas efficiency
Total fees also fell off a cliff in Q3, dropping to their lowest levels since 2020. Now that Ethereum has switched to POS, the decline in 'total fees' will impact the staking yields of the ETH2 network.
Average Daily Transactions
The average daily transactions were 1.2 million, up 6% from the previous quarter. Average daily transactions of:
$ETH transfers grew by 7%
DeFi transactions grew by 14%
NFT transactions fell 17%
Bridge transactions fell by 41%
Average Daily Active Addresses
Active addresses have a similar pattern to transactions. Average daily active addresses grew by 5% from the previous quarter to ~550,000. However, the growth was primarily due to a spike in active addresses on July 27, 2022.
The spike was caused by @ChandlerGuo announcing plans for an ETHPOW fork, along with some wallet “maintenance activity” from @binance. This indicates that the rise in active addresses wasn't brought on by a surge in new users or a novel application.
ETH Supply in Smart Contracts
Over the period, Ethereum supply grew by 0.7%. The annualized supply came in at 4.2%. All of the inflation came from PoW rewards since the burn from transaction fees (EIP-1559) was higher than the inflation from Beacon Chain rewards.
ETH in smart contracts has trended upwards since 2020 since it was increasingly used within the #DeFi ecosystem. This resulted in a multi-year decrease in $ETH held on centralized exchanges. However, the collapse of Terra seemed to have eroded trust in smart contracts.
The percentage of $ETH in smart contracts peaked at 30% on May 9, 2022 (the same day as Terra’s collapse). Since then, $ETH supply in smart contracts has trended downwards. At the end of August, it stood at 27%, falling 2% from the end of June.
LAYER 2 ANALYSIS
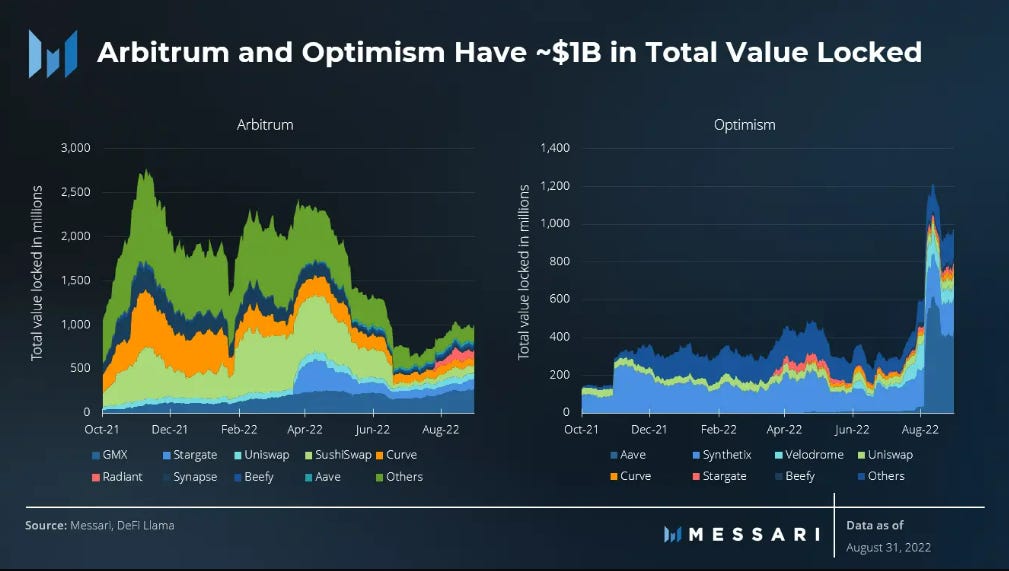
Ethereum’s scaling solution with the help of rollups has gained a lot of traction. Average transactions from January 2022 to August 2022:
@arbitrum grew from 39,000 to 115,000 (~3x)
@optimismFND grew from 41,000 to 142,000 (~3.5x)
The primary growth for these L2s is from the underlying protocols (especially GMX and Synthetix). However, some of this growth may be attributed to mercenary capital rather than organic users, as OP incentives went live and an Arbitrum airdrop is anticipated.
Catalysts for L2 growth and adoption:
Arbitrum’s Nitro upgrade (higher throughput and lower fees)
zkEVM announcements: @0xPolygon, zkSync, and Scroll
@StarkWareLtd's plans to decentralize StarkNet and launch its own token
Note:
These token launches with 'airdrops' are important events for the ecosystem. They help in creating a community. However, they may be an unsustainable approach to adoption. These ecosystems may need to create organic user adoption to thrive long term
SECTOR ANALYSIS
DEXs
The daily transaction volume of DEXs dropped from $2.7B in Q2 to $1.83B in Q3. Uniswap had ~75% of DEX market share throughout Q3. Curve’s volume share fell from 16% to 8% despite continuing to issue higher incentives than the competition.
Borrowing and Lending
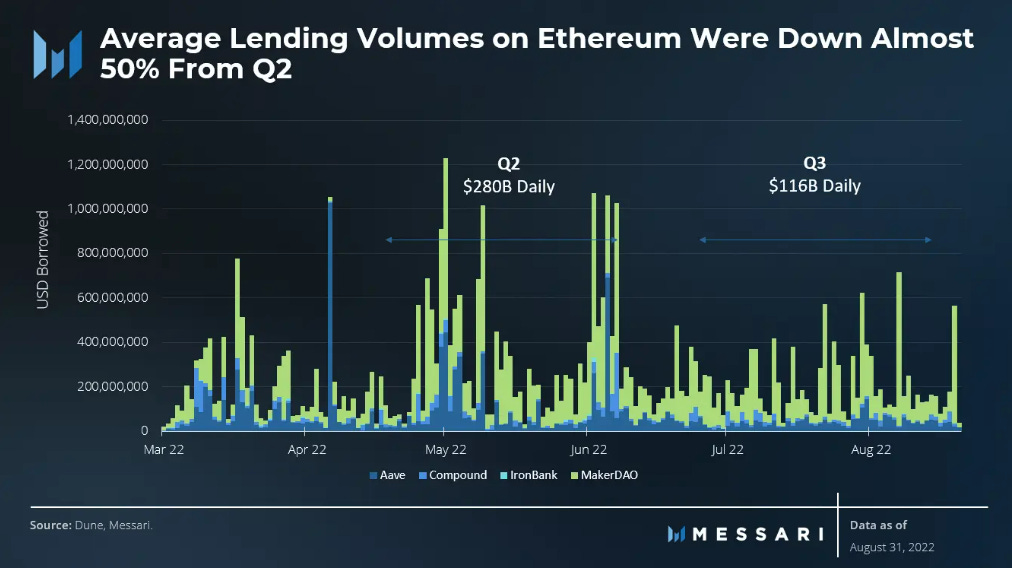
The daily average lending volume fell from $280B in Q2 to $116B in Q3. However, the volume picked up slightly in August. This could be due to the demand from spot $ETH for individuals looking to farm the $ETH POW airdrop.
NFTs
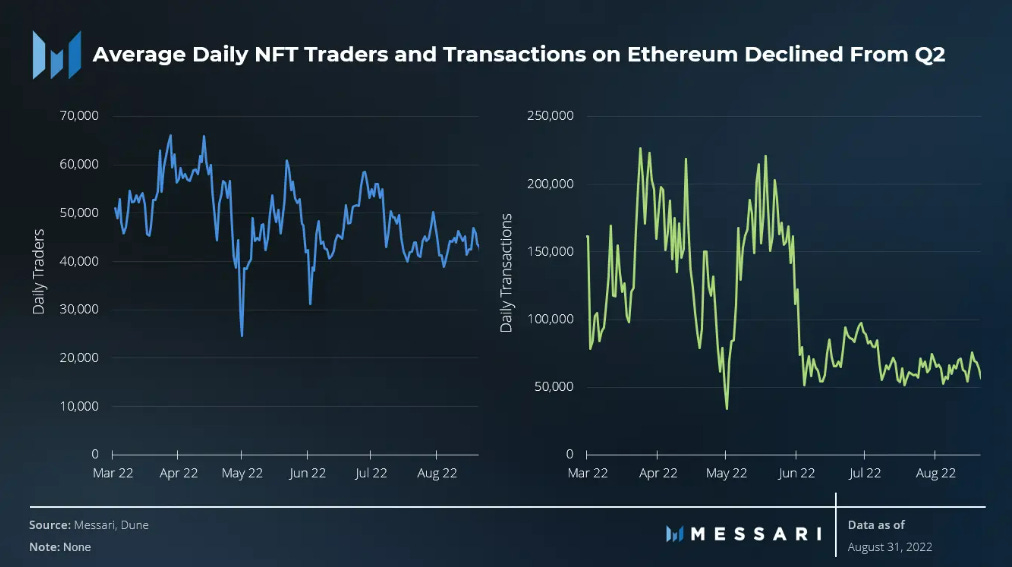
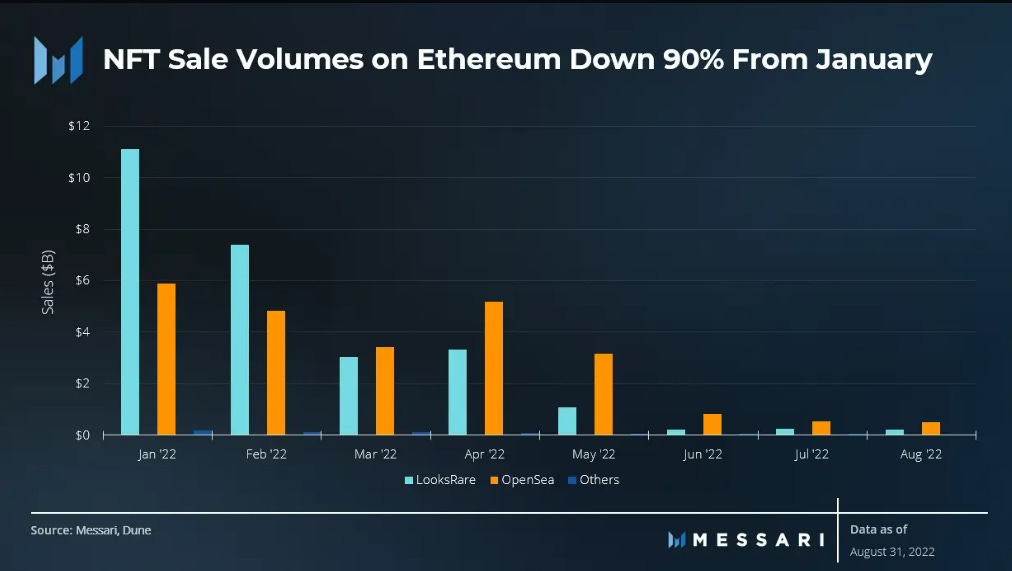
The NFT daily trading volumes dropped dramatically. However, the average number of daily traders witnessed a much smaller decline. This might indicate a sticky user base of 40,000 users per day.
NFT sale volumes (in dollar terms) fell 90% from January 2022. NFT sales have averaged less than $1B per month in Q3 compared to $4.6 billion in Q2. This decline might be due to:
Slowing market for NFTs
Drop in $ETH price
THE MERGE AND TRANSITION TO POS
The Merge occurred successfully on September 15, 2022. Miners created an ongoing POW fork called $ETHW. The chain has seen no support from users and limited support from infrastructure providers.
The #Merge resulted in a decrease of 90% in block rewards. This significantly reduces the network’s inflation and reduces its annual security expense. The transition to PoS also allowed $ETH to significantly lower energy consumption, down by 99.95%.
$ETH deposits into the Beacon Chain have slowed down significantly. It grew by only 4% compared to 17% for Q2. The primary reason for this low growth is that stETH currently trades at a discount to spot $ETH.
COMPETITIVE ANALYSIS
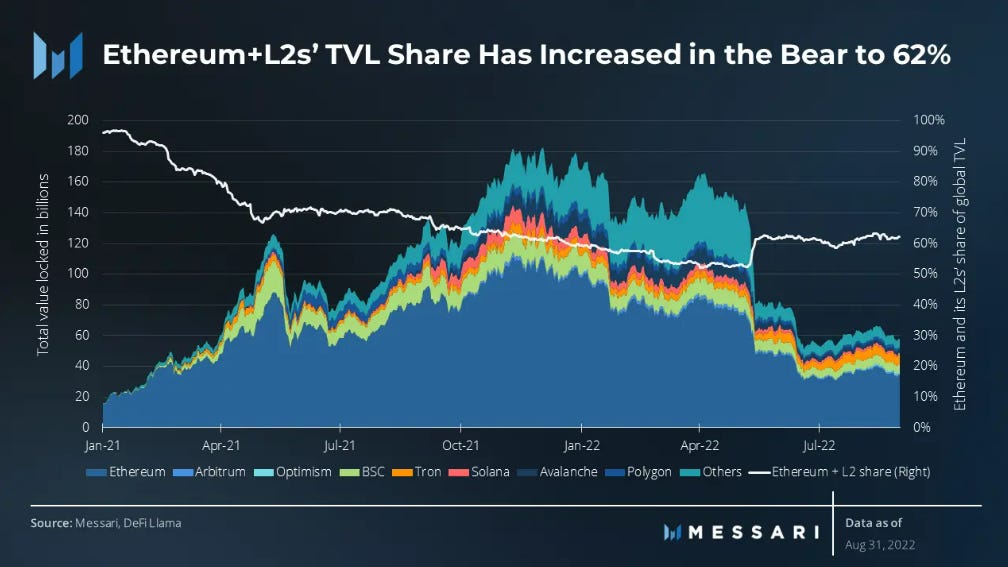
62% of Crypto's TVL is on ETH and its L2 ecosystem. $ETH contributes the lion’s share of the TVL with $34B, however, its TVL has grown by just 8% since the end of Q2.
The Ethereum ecosystem has an advantage with the number of active developers on the network. The developer activity on Ethereum has stood up better than on other ecosystems in the bear market. Its developer activity share has increased by 10% compared to last year.
NEXT STEPS ON THE ROADMAP
Developers are now looking to the Shanghai upgrade which will enable withdrawals for stakers.
EIP-4844 proposal which might be included in the Shanghai upgrade will make it cheaper for L2s to post their transactions to Ethereum L1.
The EIP-4444 proposal would enable nodes to prune the transaction history after one year. This means that the nodes don't need to download this set of history. As a result, this will drastically reduce node resource requirements and further decentralize the network.
Ethereum is expected to further scale with danksharding towards the end of 2023. With the increased volume of L2 solutions, EIP-4844, and danksharding, Ethereum will likely be fast and cheap enough for 99% of users in the next 12–18 months.
CLOSING REMARKS
Ethereum remains the most vibrant ecosystem in all of crypto, with the majority of the developer, user, and application activity. However, with new L1s like Aptos, Sui, and Celestia, it will have to continue to build its moat to remain the top dog!
Subscribe to receive our weekly newsletter and in-house research content!
Please Share, Leave Feedback, and Follow Us on Twitter, Telegram, and LinkedIn to stay connected with us.


